
Study Guide
Field 039: School Administrator—Building Level
Sample Constructed-Response Assignment
The following materials contain:
- Directions for the constructed-response assignment
- A sample constructed-response assignment
- An example of a strong response to the assignment
- The performance characteristics and scoring scale
Directions for the Constructed-Response Assignment
This section of the test consists of one constructed-response assignment in which you will be asked to respond to an assignment presented on-screen. You should prepare a response of approximately 500–800 words. You may use the word-count feature in the lower left-corner of the response box to monitor the length of your response. You will not be allowed to type more than 1000 words.
Read the assignment carefully and think about how you will organize your response before you begin to type.
Your response will be evaluated on the following criteria:
Purpose: The extent to which the response achieves the purpose of the assignment.
Subject Matter Knowledge: The accuracy and appropriateness in the application of subject matter knowledge.
Support: The quality and relevance of supporting details.
Rationale: The soundness of argument and degree of understanding of the subject matter.
Be sure to write about the assigned topic. You may not use any reference materials. Your response must be your original work, written in your own words, and not copied or paraphrased from some other work. Remember to review what you have written to ensure that you address all aspects of the assignment and make any changes you think will improve your response. The final version of your response should conform to the conventions of edited American English.
Sample Constructed-Response Assignment
You were recently appointed principal of Deer Run Middle School. You currently work in another region of the state, so your knowledge of the school and the local community is limited. Before you arrive at Deer Run, the central office in your new district sends you some information about the school, including data derived from Deer Run's most recent school report card.
Write an analysis of 500–800 words in which you analyze the data provided. In your analysis:
- identify two important school issues and/or needs suggested by the data, and explain the significance of each.
For one of the issues/needs you identified:
- describe two approaches you would use to learn more about the nature or cause(s) of that issue/need, and explain why each of these approaches would be useful; and
- describe two strategies you and/or your staff should include in a plan to address the identified issue/need, and explain why each strategy you described would be effective.
Student Performance Indicators for Deer Run Middle School (Grades 6–8)
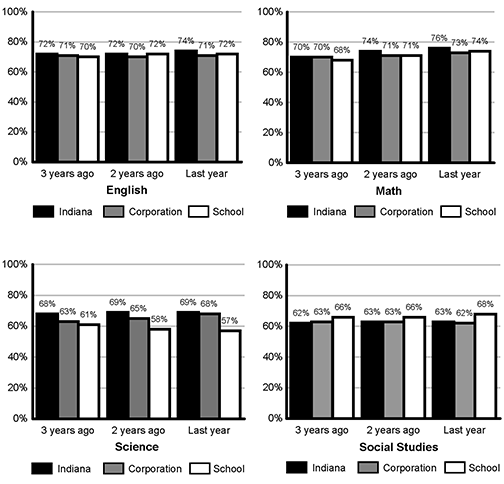
Standardized Assessment Results for All Students
Three-Year ComparisonThe graphs below display the percentage of students who passed the state assessments in all groups.
Student Performance Indicators for Deer Run Middle School (Grades 6–8)
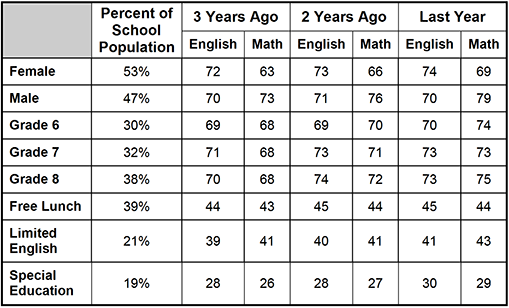
Standardized Assessment Results by Student Group
Three-Year ComparisonThe table below displays the percentage of students who passed the state assessments by group.
Student Performance Indicators for Deer Run Middle School (Grades 6–8)
Student Growth Model (English)% of lowest performing students with high growth:........39%
Target is ≥ 43%
% of highest performing students with high growth:......35%
Target is ≥ 37%
% of ALL students with low growth:...........................43%
Target is < 40%Student Growth Model (Math)
% of lowest performing students with high growth:.........43%
Target is ≥ 45%
% of highest performing students with high growth:........40%
Target is ≥ 38%
% of ALL students with low growth:.............................39%
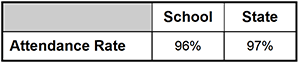
Target is < 41%Attendance Rate Last Year
Sample Strong Response to the Constructed-Response Assignment
The school report card data I received suggest areas of ineffective performance that would be important for me to address as the new leader of Deer Run Middle School. Two of these areas involve the school's performance in science and its gender gap in math.
Deer Run has had at least a three-year history of declining science scores. During this same period, the district has made steady gains in science and the state has maintained a higher level performance, leading to an increased gap between the school's performance and that of the district and state. This may indicate a problem with science instruction or possibly a curriculum content or alignment issue. Whatever the cause, Deer Run students are being deprived of the opportunity to be as prepared as they should be in science, which could have negative implications for their ability or desire to pursue further education and ultimately careers in science-related areas.
Regarding the gender gap in math, the three-year data indicate that although female students' gains have paralleled those of the male population, they remain ten percentage points behind males in performance. This may suggest problems with instruction or curriculum implementation and is significant because all students, regardless of gender or other demographic factors, deserve an equitable opportunity to achieve across the curriculum, especially in a foundational area such as math.
I would begin trying to address the persistent gender gap in math performance by taking steps to learn more about the nature and causes of the issue. First, I would involve all math staff in conducting a thorough analysis of available formative and summative standardized assessment results, with a focus on identifying and exploring specific performance differences for female versus male students. This would provide a firm foundation for later discussions and analyses aimed at addressing areas of particular need for female students. Involving all math staff in this work would maximize input on how the data can be used to inform practice and could help promote buy-in for eventual change. Second, I would work with the math coordinator to conduct classroom walk-throughs aimed at observing teacher-student interactions, female student engagement, and classroom management practices. The goal would be to assess how to better meet the needs of female students, with a focus on curricular content and instructional practice. This step would be useful in gaining first-hand knowledge of classroom dynamics and insight into the instructional practices of teachers and how they may be influencing female students' math performance.
Strategies I would include in a plan to address the gender gap in math include the following. First, I would arrange time and support for the math faculty at each grade level to engage in collaborative analysis of students' math performance by gender. Math teachers at each grade level would gather periodically to review many types of data regarding their female and male students' math performance, including standardized and classroom assessment results and samples of student work. Meetings would focus on collaborative analysis of relevant data, sharing of gender-related instructional issues teachers are encountering in their own classes, and sharing of insights and ideas about areas of particular need in female students' math performance and potential solutions. Collaborating in this way would help maintain every teacher's focus on continuous instructional improvement and would expand opportunities for generating solutions that can address the gender gap in math.
A second strategy I would include in the plan is a review of the current research literature on closing gender gaps in math. One or more members of the math faculty would be charged with conducting this review and then reporting back to their colleagues on what they find. Use of this strategy would help focus math faculty on best-practice instructional strategies with proven positive results. It would also help reduce the time required to generate workable solutions and minimize the likelihood of false starts using unproven and ineffective approaches.
Performance Characteristics for the Constructed-Response Assignment
The following characteristics guide the scoring of responses to the constructed-response assignment.
| Purpose | Extent to which the response achieves the purpose of the assignment |
|---|---|
| Subject Matter Knowledge | Accuracy and appropriateness in the application of subject matter knowledge |
| Support | Quality and relevance of supporting details |
| Rationale | Soundness of argument and degree of understanding of the subject matter |
Scoring Scale for the Constructed-Response Assignment
Scores will be assigned to each response to the constructed-response assignment according to the following scoring scale.
| Score Point | Score Point Description |
|---|---|
| 4 |
The "4" response reflects a thorough knowledge and understanding of the subject matter.
|
| 3 |
The "3" response reflects a general knowledge and understanding of the subject matter.
|
| 2 |
The "2" response reflects a limited knowledge and understanding of the subject matter.
|
| 1 |
The "1" response reflects a weak knowledge and understanding of the subject matter.
|
| U | The response is unrelated to the assigned topic, illegible, primarily in a language other than English, not of sufficient length to score, or merely a repetition of the assignment. |
| B | There is no response to the assignment. |