
Study Guide
Core Academic Skills Assessment (CASA)
Sample Multiple-Choice Questions
Mathematics
The following reference material will be available to you during the test:
Objective 0005
Number and Quantity (Standard 9)
1. A shopper's entire purchase included 2 neckties that cost $12.75 each, a shirt that cost $22.00, and a pair of shoes that cost $45.50. If the sales tax on the entire purchase was 6%, how much change did the shopper receive from a $100 bill?
- $1.42
- $3.26
- $4.60
- $6.74
- Answer and Rationale
- Correct Response: A.
This question requires the examinee to demonstrate the ability to solve multistep problems using a variety of number representations. The cost of the items purchased is found by 12.75 × 2 + 22.00 + 45.50 = 93.00. The purchase plus the tax is found by 93.00 + (93.00 × 0.06) = 98.58. If the shopper tenders a $100 bill, the change is found by$100.00 – $98.58 = $1.42 .
2. Use the table below to answer the question that follows.
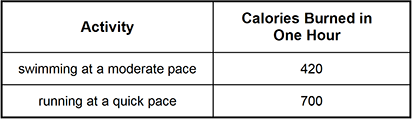
A person is using the table as a guide to plan an exercise routine. About how many minutes would the person have to swim at a moderate pace to burn the same number of calories burned by running at a quick pace for 24 minutes?
- 14 minutes
- 36 minutes
- 40 minutes
- 50 minutes
- Answer and Rationale
- Correct Response: C.
This question requires the examinee to demonstrate the ability to apply ratio concepts and proportional reasoning to solve real-world problems. The number of calories burned by running for 24 minutes is found by
The number of minutes that a person needs to swim to burn 280 calories is found by
Objective 0006
Algebra and Functions (Standard 10)
3. Solve 1.5(y + 4) = 7.5y – 9 for y.
- y = 1.4
- y = 1.7
- y = 2.2
- y = 2.5
- Answer and Rationale
- Correct Response: D.
This question requires the examinee to demonstrate the ability to solve one-variable equations. Since 1.5(y + 4) = 7.5y – 9, then by the distributive property 1.5y + 6 = 7.5y – 9. By adding 9 to and subtracting 1.5y from both sides of the equation as follows, 1.5y – 1.5y + 6 + 9 = 7.5y – 1.5y – 9 + 9 means 15 = 6y and
Objective 0007
Measurement and Geometry (Standard 11)
4. Use the diagram below to answer the question that follows.
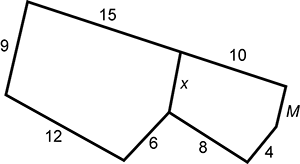
If the two pentagons shown are similar, what is the measure of side M?
- 3
- 4
- 5
- 6
- Answer and Rationale
- Correct Response: B.
This question requires the examinee to demonstrate the ability to apply the concept of similarity. Since the two pentagons are given as similar, then corresponding sides of the pentagons form ratios that are equal to each other, such as: . Using
  and cross multiplying means 15x = 90 and x = 6. Since x = 6, then
  . Again, by cross multiplying 15M = 60 and M = 4.
Objective 0008
Statistics and Probability (Standard 12)
5. Use the graph below to answer the question that follows.
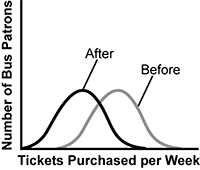
A small city's transit company has made significant changes to its bus routes. Weekly bus ticket sales before and after making the changes are displayed in the graph. The distributions in the graph show that the changes made to bus routes produced which of the following outcomes?
- The standard deviation of bus ticket sales has decreased.
- Bus patrons seem to be buying fewer tickets.
- The standard deviation of bus ticket sales has increased.
- Bus patrons seem to be buying more tickets.
- Answer and Rationale
- Correct Response: B.
This question requires the examinee to demonstrate the ability to make inferences about populations that are based on comparisons of center, variability, and visual overlap of distributions. The shape or spread of the "Before" curve seems identical to that of the "After" curve. This means that the variability between the two curves is similar or the same. The mean of the "After" curve, that is the point on the horizontal axis that corresponds with the high peak of the curve, is less than that of the "Before" curve. This analysis allows the conclusion that patrons seem to be buying fewer tickets after the bus routes were changed.